Birds Near and Far
Home books dvds apps sites extra maps links contact us blog Buy
Birds Near and Far
Home books dvds apps sites extra maps links contact us blog Buy
A blog by Dave Gosney about some of the birds and places that feature in his books and DVDs but also about the state of birds in the Sheffield area

Blog archive
12/7/22 The State of Sheffield’s Birds
20/12/2016 Changes in SK29 this decade
5/2/2015 - Peak District Ring Ouzels
14/1/2015 - Sheffield Bird Counts 88-90 data archive and analysis
16/9/14 - The sudden demise of a whole population
06/4/14 - (Very) recent declines in Sheffield birds
Numbers of birds around Sheffield
There’s another of my papers in the new Sorby Record (No 57, 2021), published last week and available here). This paper brings together the results of many of my previous papers and presents them as a series of maps showing the abundance and distribution of almost every species around Sheffield in 2016-21 and comparing that with what we found in 1988-90 and 2003-08.
Here’s an example of one of the maps
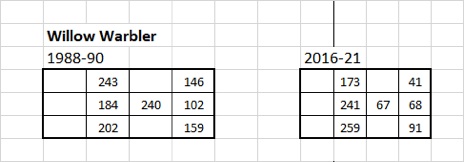
The 12 ‘squares’ in each grid are the 12 hectads (10 km squares) in the study area of the Sheffield Bird Study Group; the middle ‘numbered square’ shows where the city of Sheffield is. The number in each square represents the total number of Willow Warblers counted in 24 or 25 1-hour birdwatching walks in that area. Blank hectads were not studied. The map allows us to compare the numbers present in the last few years with what was counted in 1988-90. In this case, note the striking decline in numbers in the Sheffield ‘square’ and all three squares to the east.
And here’s an example of another of the maps
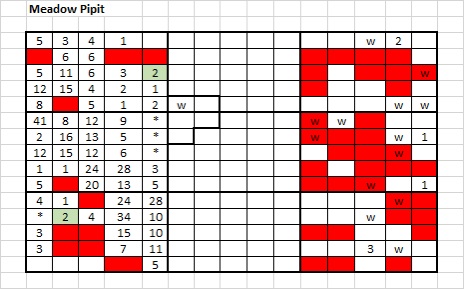
This shows 9 of the same hectads (the 3 westernmost hectads are excluded).
The number in each square indicates how many Meadow Pipits were counted in that tetrad in a 1-hour spring-time birdwatching walk during 2016-21. An * means it was recorded but not within the hour, a w means it was found during a 1-hour walk in winter. Red squares show where Meadow Pipits were not found in my 2016-21 surveys, even though they were present during the breeding birds survey of 2003-08; ie these are tetrads where Meadow Pipits may have disappeared since 2003-08 . Green squares show where they were found in 2016-21 but not in the 2003-08 survey. Note that in the breeding season I failed to find Meadow Pipits in almost all the tetrads to the east of Sheffield that had been occupied about 15 years earlier.
The printed version in the paper is in monochrome but the patterns are still clear.
These are just samples of the maps in the paper. Similar maps are shown for almost all the other breeding species, giving an insight, not just into current numbers across the area but also into what has happened to bird numbers since 1988-90 and where birds may have been lost from tetrads since 2003-08.